Google Ads Quality Score: How Do You Improve It, and Does It Still Matter?
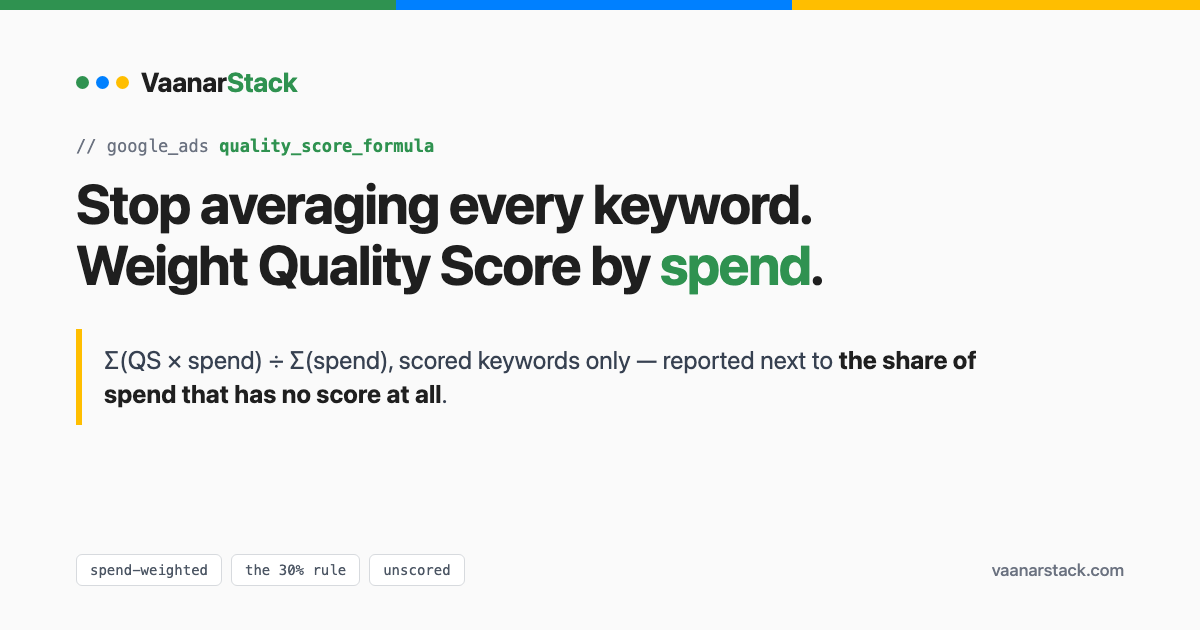
Google Ads Quality Score is a 1–10 diagnostic reported per keyword, built from three components: expected CTR, ad relevance and landing page experience. The Google Ads quality score formula most people need is not Google's internal weighting — it is the one they use to roll those per-keyword scores up into a number they can act on. And that is where almost every account gets it wrong, because the obvious method (average every keyword equally) produces a figure that describes nothing.
Below: the calculation that actually works, the two numbers to track instead of one, and how to move each component.
The mistake almost everyone makes with the average
Here is the finding from a real audit run, and it is the whole argument in two sentences:

Six of the seven keywords actually driving revenue had no Quality Score at all. Google had not finalised one. Any straight average you compute is an average over the keywords that matter least.
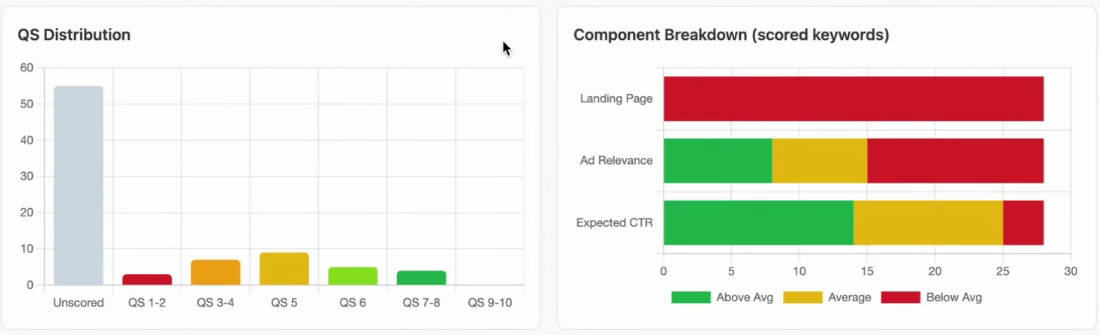
Two things are visible here that a single averaged number destroys. The tallest bar in the distribution is Unscored. And in the component breakdown, landing page experience is uniformly Below Average while expected CTR is mostly Above Average — so the ads are doing their job and the destination is dragging the account down. That is a specific, actionable diagnosis. "Average QS 4.6" is not.
In a separate, larger anonymised account we audited, the same distortion appeared at scale: 3,679 ad groups, of which only 33 carried any spend at all. The unweighted average was computed across 3,646 ad groups that cost nothing.
How do you calculate a spend-weighted quality score?
Two numbers, not one. Neither is complicated, and together they tell you something the account-level average never will.
1. The spend-weighted average, over scored keywords only
Weight each keyword's Quality Score by what that keyword actually spent, and exclude unscored keywords entirely — they have no score to average:
Spend-weighted QS = Σ(QS × spend) ÷ Σ(spend) — summed across scored keywords only
2. The share of spend that is unscored
The first number is only trustworthy if you know how much of the account it covers. So track the blind spot alongside it:
Unscored spend share = spend on unscored keywords ÷ total spend
If that second number is high, your weighted average is describing a minority of your budget and should be treated with suspicion. This is the pair to put on a dashboard: one number for how good the scored spend is, one for how much spend is not scored at all.
A worked example
Five keywords, illustrative figures, to show the arithmetic:
| Keyword | Quality Score | Spend | QS × spend |
|---|---|---|---|
| A | 8 | Rs 40,000 | 320,000 |
| B | 7 | Rs 20,000 | 140,000 |
| C | 4 | Rs 30,000 | 120,000 |
| D | 3 | Rs 10,000 | 30,000 |
| E | Unscored | Rs 50,000 | excluded |
Straight average of the four scored keywords: 5.5. Spend-weighted average: 610,000 ÷ 100,000 = 6.1. And the unscored spend share is 50,000 ÷ 150,000 = 33%.
So the honest reading is not "our Quality Score is 5.5". It is "6.1 across the two-thirds of spend that carries a score, and a third of our budget has no score at all". Those are different conversations, and only the second one tells you where to look.
The 30% rule, and what to do when you breach it
The working threshold we use: do not let more than 30% of spend sit below Quality Score 6. It is a budget guardrail, not a quality target. If you breach it, you are systematically paying a premium on a third of your money, and the fix list is now ordered — start with the highest-spending low-score ad group and work down. If you are under it, low scores elsewhere in the account are mostly noise.
This is exactly the kind of threshold that belongs in an automated routine rather than a monthly manual review; we describe how we run it in what a Claude Google Ads audit actually checks.
What are the three components, and which can you move?
| Component | What Google measures | How fast it moves | What you change |
|---|---|---|---|
| Expected CTR | Likelihood of a click, normalised for position | Slowly — it needs impressions | Tighter ad groups, closer keyword-to-ad match |
| Ad relevance | How well the whole ad matches the keywords in the ad group | Fast — a new ad can move it | Rewrite the ad to the keyword set; the measurable check is whether the keywords appear in the headlines |
| Landing page experience | Relevance and usability of the destination — and whether it can be crawled at all | Slowest — it needs a crawl | Match the promise, confirm crawlability, then load time |
Quality Score is not Ad Rank
They get used interchangeably and they are not the same thing. Ad Rank decides whether and where you show, and it takes your bid, the auction context, expected impact from extensions, and a real-time quality assessment. The Quality Score in your interface is a reported diagnostic, calculated separately and refreshed on its own schedule. You can lose an auction with a QS of 9. You can win one with a 5 and a bigger bid.
Does quality score still matter in 2026?
Yes — as a cost lever, not a scorecard. A lower score means you pay more for the same position, because Ad Rank has to be made up somewhere and the only lever left is your bid. What has changed is not the mechanism but the reporting: with more of the account unscored, and more spend flowing through campaign types that have no keywords to score, the account-level number has become steadily less meaningful while the spend-weighted one has stayed useful.
We are deliberately not putting a CPC multiplier table here. The commonly circulated "QS 5 costs you 25% more" figures do not carry a source we can verify, and inventing one would undercut the point. The spend-weighted view above tells you how much of your money is exposed, which is the number that drives a decision.
One honest caveat on our own data: what we hold is a cross-section — spend by Quality Score band at a point in time — not a before-and-after on a single account. We are not going to imply a causal lift we have not measured.
How do you improve quality score?
In the order worth doing them.
1. Fix the ad group structure first
This is upstream of everything else, and it is the reason most accounts have a low score they cannot shift. If one ad group holds keywords with genuinely different intent, no single ad can be relevant to all of them — so ad relevance is capped before you write a word.
An ad group containing running shoes, running shoes for flat feet, cheap trail running shoes and nike pegasus 41 is four different searches. One is generic, one is a medical fit problem, one is price-led and off-road, one is a specific model. An ad that speaks to the flat-feet searcher is irrelevant to the model-number searcher, and vice versa. Split them into intent-tight groups and each can have an ad that actually matches. Do this before touching copy, or you will be rewriting ads to solve a structural problem.
2. Ad relevance: match the whole ad, and get the keywords into the headlines
Ad relevance is about the ad as a whole answering the keywords in its group — the headlines, the descriptions, and the offer all pointing at the same intent. The part you can actually measure and check is whether those keywords appear in the headlines, so use that as the test, but do not stop there. An ad with the keyword in headline one and a description written for a different product still reads as a mismatch.
3. Expected CTR: tighten the ad group, do not raise the bid
Expected CTR is normalised for position, so bidding more does not improve it. What improves it is fewer, closer keywords per ad group — which is step one again, arriving from a different direction.
4. Landing page experience: relevance, then crawlability, then speed
Everyone jumps to page speed. Relevance comes first: a fast page answering a different question than the ad promised still scores badly.
Then check that the page can actually be crawled. This is the one people miss, because landing pages are often built outside the main site and nobody applies SEO thinking to them. A page blocked in robots.txt, sitting behind a redirect chain, rendering its content only in JavaScript, or served from a subdomain nobody links to, may be effectively invisible to Google's crawler. If the crawler cannot read it, it cannot assess it, and the component stays poor no matter how good the page looks to you. Fetch the URL as a bot before you redesign anything.
5. Then wait, and check the right column
Ad relevance can move in days. Expected CTR needs enough impressions to re-establish a pattern, so think weeks. Landing page experience is slowest, because it depends on a re-crawl. If you changed everything at once and nothing moved after a fortnight, that is normal, not failure.
Does pausing low-QS keywords help the account?
It is the wrong question, and it is worth replacing with the right one.
Pausing changes the reported average by changing what is in the sample. It does not make a single click cheaper. So if you are pausing to improve a number, you are managing the report rather than the account.
The question that matters is whether the keyword is business relevant:
- If it is relevant and spending — a term your customers genuinely search and you genuinely want — then a low Quality Score is a problem to fix, not to remove. Work the three components: is it in the right ad group, does the ad match it, does the landing page answer it. Pausing it here means paying for the traffic elsewhere, usually at a worse price.
- If it is not relevant — it attracts the wrong intent, or the traffic never converts — then pause it because it is wrong for the business, and treat the score as the symptom that surfaced it rather than the reason.
Either way the decision comes from relevance and spend, never from the score on its own.
Why your quality score dropped after you paused a keyword
The reverse also happens and it alarms people. Remove a high-scoring keyword and the average falls. Nothing got worse; the composition changed. Check the historical columns before reacting.
Does quality score affect Performance Max?
There are no keywords to score in PMax, so there is no Quality Score to read. The nearest equivalent signal is impression share — specifically, share lost to budget versus share lost to rank, which tells you whether the constraint is money or competitiveness. For what the API will and will not expose here, see what the Google Ads MCP can and cannot do.
Can you see quality score history?
Yes — there are three historical columns available in the interface, and a reporting trap inside them. They report against your selected date range, so changing the range silently changes what you are looking at. Compare two periods without noticing the range moved and you will read a change that never happened.
FAQ
How is Google Ads quality score calculated?
Per keyword, from three components: expected CTR, ad relevance and landing page experience, each reported as Below average, Average or Above average, rolled into a 1–10 score. Google does not publish the internal weighting. The calculation you control is how you roll those per-keyword scores up — and that should be a spend-weighted average across scored keywords, reported alongside the share of spend that is unscored.
What is a good quality score?
Above 6 on the keywords that carry your spend. The account-wide average is not a useful target, because it is dominated by keywords with little or no spend, and often by keywords Google has not scored at all.
Which of the three components matters most?
The one that is Below Average on your spending keywords. In the audit shown above, landing page experience was Below Average across every scored keyword while expected CTR was mostly Above Average — so the ads were fine and the destination was the problem.
Does pausing low-QS keywords help the account?
It changes the reported average without making any click cheaper. Decide on business relevance instead: if the keyword is one you want, fix the components rather than pausing it; if it is not, pause it because it is wrong for the business, not because of the score.
Why did my quality score drop after I paused a keyword?
Because the average is recomputed over what remains. Pausing a strong keyword lowers the average without anything degrading. Look at the historical columns rather than the headline number.
Is quality score the same as ad rank?
No. Ad Rank decides whether and where your ad shows and takes your bid, the auction context and expected extension impact alongside a real-time quality assessment. Quality Score is a reported diagnostic on a separate refresh cycle.
Does quality score affect Performance Max?
No — PMax has no keywords to score. Use impression share lost to budget versus rank as the closest available read on whether you are constrained by money or competitiveness.
If you would rather see this run against your own account than build it, our free Google Ads audit produces the spend-weighted view and the ranked fix list.
