Hook Rate vs Hold Rate: What's the Formula, and What's a Good Score?
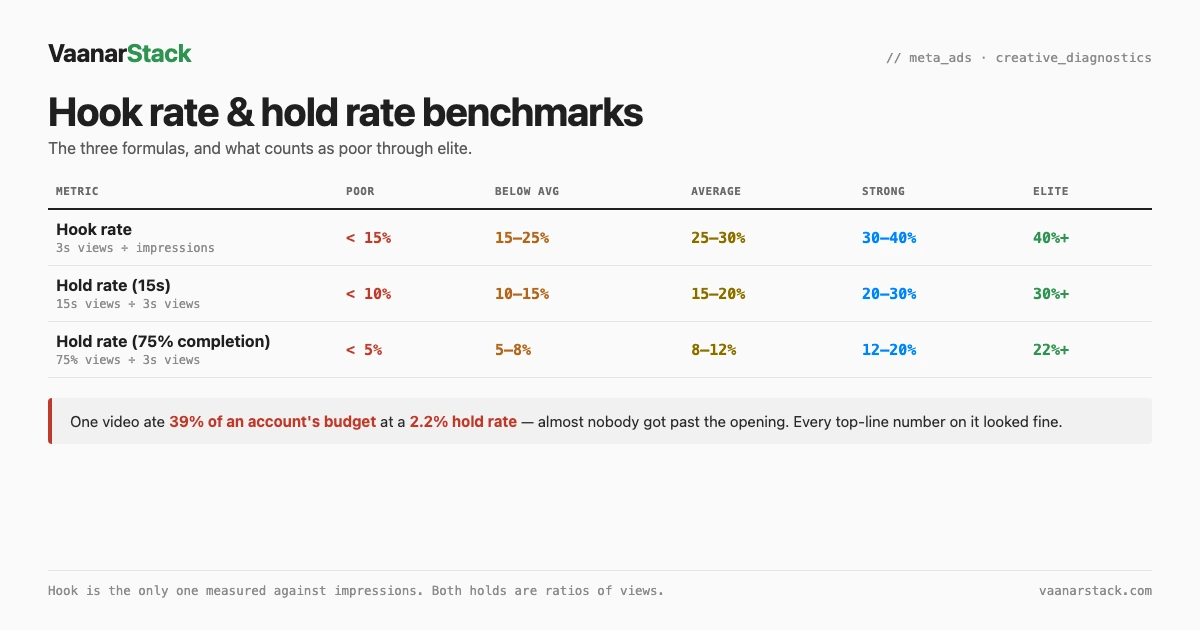
Hook rate is 3-second video views divided by impressions. Hold rate is 15-second views divided by 3-second views. That is the whole hook rate and hold rate formula: the first tells you whether your opening frame stopped the scroll, the second tells you whether the ad kept the person it stopped. A third cut — hold rate at 75% completion — tells you whether they stayed to the end. Below are the benchmark bands for all three, what each one means when it breaks, and the one measurement trap that catches people who automate this.
What are hook rate and hold rate?
Meta gives you a pile of video metrics and no opinion about which ones matter. Hook and hold are the two that turn a video into a diagnosis, because they split one number — "people watched it" — into two separate questions with two different owners.
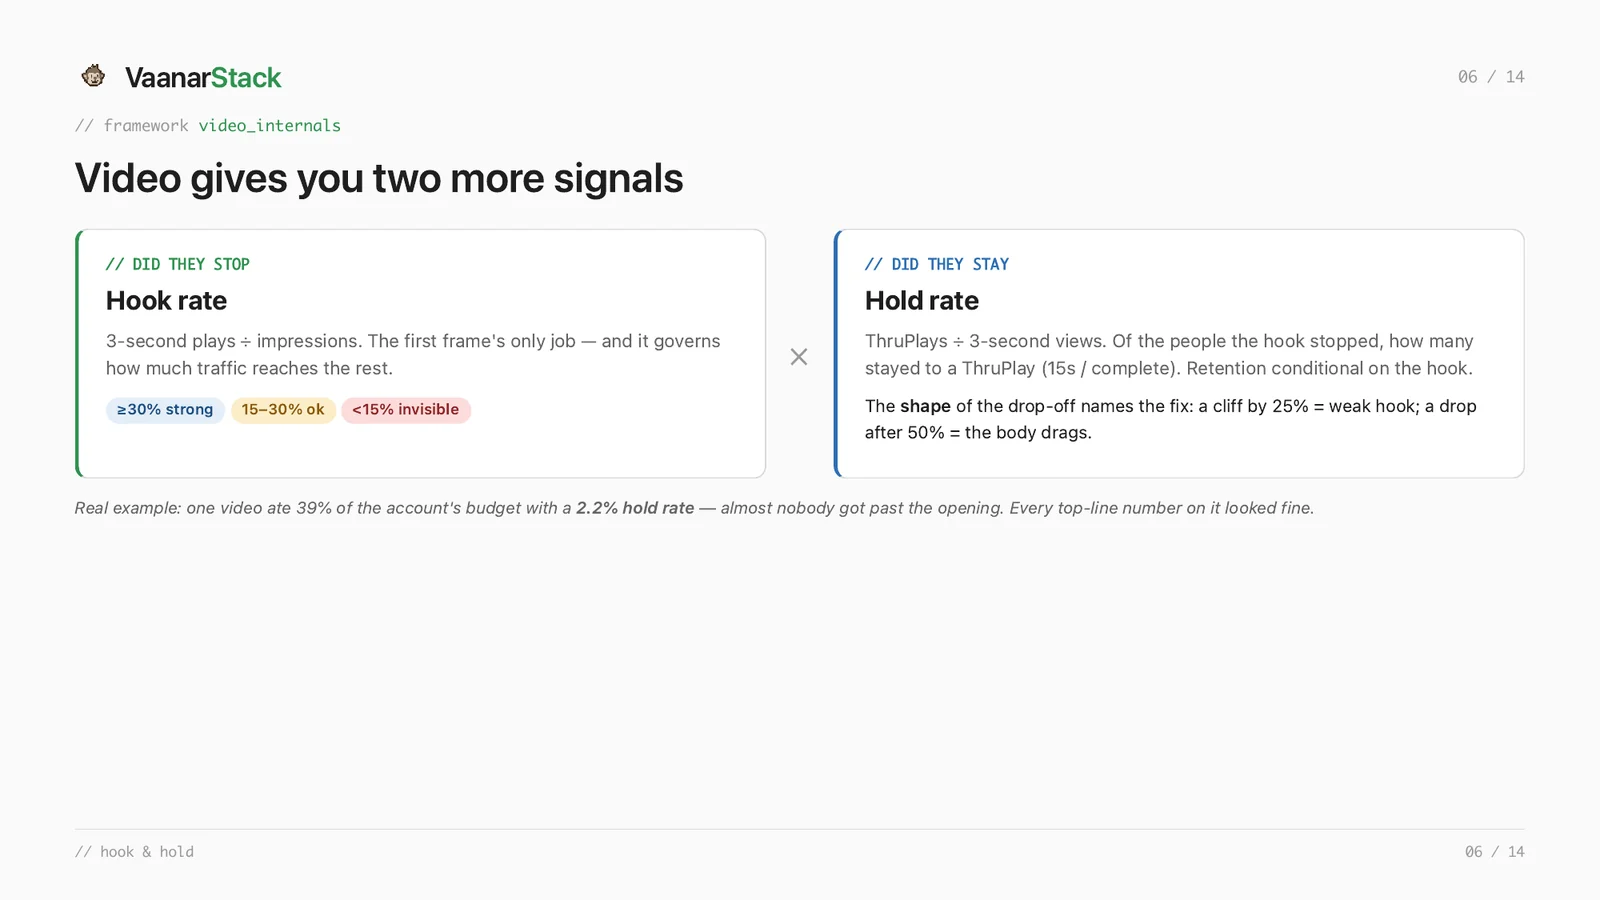
From our creative-diagnostics walkthrough. The example on the right is the reason this matters: one video ate 39% of that account's budget at a 2.2% hold rate — almost nobody got past the opening, and every top-line number on it looked fine.
The three formulas, written out
| Metric | Calculation | What it actually measures |
|---|---|---|
| Hook rate | 3-second views ÷ impressions | Did the first frame stop the scroll? This is the only one measured against impressions. |
| Hold rate (15s) | 15-second views ÷ 3-second views | Of the people the hook stopped, how many stayed? Retention conditional on the hook. |
| Hold rate (75%) | 75% views ÷ 3-second views | Did they reach the end? Proportional to length, so it survives comparison across formats. |
The conditional part is what people get wrong. Hold rate is not "how many of the impressions watched 15 seconds" — it is a ratio of views to views. A weak hook shrinks the denominator, which can make a mediocre ad's hold rate look excellent on a tiny base.
Where the numbers live in Ads Manager
Neither is a default column. Both are custom metrics you build once:
- Hook rate — create a custom metric dividing 3-second video plays by impressions.
- Hold rate — divide ThruPlays by 3-second video plays. ThruPlay is 15 seconds or completion, whichever comes first.
- Hold rate at 75% — divide video watches at 75% by 3-second video plays.
Save them to a column preset. If you rebuild them per report you will eventually mix up a denominator, and the two hold rates are easy to confuse.
What is a good hook rate and hold rate?
Here are the bands we work to. Treat them as direction, not as a pass mark — more on that below.
| Metric | Poor | Below average | Average | Strong | Elite |
|---|---|---|---|---|---|
| Hook rate 3s ÷ impressions |
< 15% | 15–25% | 25–30% | 30–40% | 40%+ |
| Hold rate (15s) 15s ÷ 3s |
< 10% | 10–15% | 15–20% | 20–30% | 30%+ |
| Hold rate (75%) 75% ÷ 3s |
< 5% | 5–8% | 8–12% | 12–20% | 22%+ |
Hook rate: under 15% is a fix, 40%+ is elite
Below 15% the ad is effectively invisible — it is being served and skipped, and every downstream number is computed on a sliver of your audience. This is the cheapest thing in the account to fix, because it is the first three seconds of one asset, not a strategy.
Hold rate at 15 seconds: under 10% is a fix, 30%+ is elite
A hold rate under 10% means the opening wrote a cheque the body did not honour. The usual cause is a hook engineered for attention rather than for the thing the ad is actually about — the pattern-interrupt lands, the viewer works out it is not for them, and leaves.
Hold rate at 75% completion — the one most people skip
ThruPlay is a fixed 15-second threshold, so it means different things on a 15-second ad and a 90-second one. On the short ad, 15 seconds is the whole thing; on the long one it is the first sixth. That makes ThruPlay-based hold rate a poor way to compare creative of different lengths — which is exactly what most accounts are full of. The 75% measure is proportional, so it stays honest across formats. If you only track one hold number across a mixed library, track this one.
Read the bands as direction, not as a pass mark
Objective, placement and CPM all move the floor. A broad-reach awareness campaign buying impressions at a very low CPM will sit lower on hold rate than a tightly-targeted conversion campaign, and that is not a creative failure — it is a different auction. Use the bands to decide which way to move, then set your own working thresholds from your account's own history.
Do not judge either number before the maturity gate
Neither metric is stable at low volume. A thousand impressions is not a verdict; it is noise with a decimal point. Wait for the ad to accumulate enough delivery that the ratio stops moving between refreshes, then read it. Most of the bad creative calls we see are not wrong analysis — they are correct analysis run three days early.
How do you actually pull these numbers — and the trap if you automate it
This is where it gets interesting if you are pulling metrics through an API or an AI assistant rather than reading Ads Manager.
All three metrics share one denominator: 3-second views
Hook rate divides by impressions, but both hold rates divide by 3-second views. So the 3-second number is the single value the whole framework rests on. Lose it and you cannot compute two of the three.
The Meta Ads MCP does not expose a 3-second field
We went looking for it while wiring these metrics into an automated audit. The ad-level field list on Meta's official Ads MCP carries video plays, a 2-second continuous field, ThruPlays and the 25/50/75/95/100 percentile fields — but there is no 3-second-views field at all. Requesting one is rejected outright. You get two of the three numerators (ThruPlay covers the 15-second view, the 75% percentile covers the completion view) and not the shared denominator.
The trap: substituting video plays for 3-second views
The obvious workaround is to use video plays instead. Don't. Video plays counts autoplay starts, not intentional views, so as a share of impressions it lands in the 90–99% range on essentially every video ad in every account we have looked at. It is not a hook rate. It cannot separate a good opening from a bad one, and worse, it looks like a healthy number — so an automated report built on it will quietly tell you every ad is fine.
What to do instead
| Metric | Numerator available via the MCP? | Denominator | Where to read it |
|---|---|---|---|
| Hook rate | No — no 3-second field | Impressions (available) | Ads Manager custom metric, or the raw API |
| Hold rate (15s) | Yes — ThruPlays | 3-second views (not available) | Pull the denominator once, automate the trend |
| Hold rate (75%) | Yes — 75% percentile | 3-second views (not available) | Same — and this is the one worth automating |
In practice: read the 3-second number where it exists, and let the assistant do the part it is actually good at — watching the ratios move week over week and telling you which ad changed. That division of labour is the same one we describe in what an AI assistant can and cannot manage in an ad account.
Hook high, hold low — and the other three combinations
The two numbers are only useful together. Read as a pair, they localise the problem to a specific part of the asset.
| Hook | Hold | The read | The action |
|---|---|---|---|
| High | Low | The opening oversold it | Re-cut the body, keep the hook |
| Low | High | Good ad, invisible opening | Re-edit the first 3 seconds only |
| Low | Low | The concept is not landing | Kill it — a new opening will not save it |
| High | High | The video is doing its job | Look downstream, not at the creative |
Strong hook, weak hold: the first 3 seconds oversold it
The most common shape, and the most fixable. The opening earned attention the rest of the ad did not deserve. Keep the hook and rebuild what follows it.
Weak hook, strong hold: re-edit the opening, keep the concept
This is the one people get wrong most expensively. A low hook rate suppresses everything downstream, so the ad looks like a failure on top-line metrics — and gets killed. But a strong hold rate is proof the concept works on the few people who saw it. You are throwing away a good ad that needed a new first three seconds.
Both weak: kill the concept
No opening rescues an idea nobody wants. Kill it and bank the learning rather than iterating on the edit.
Both strong but sales flat: this is not a creative problem
If people stop and stay and still do not convert, the video has done its job. The problem is after the tap.
My hook rate is high but sales are flat — what does that mean?
It means the cost problem is not in the creative, and hook rate cannot tell you where it is. For that you decompose the result cost.
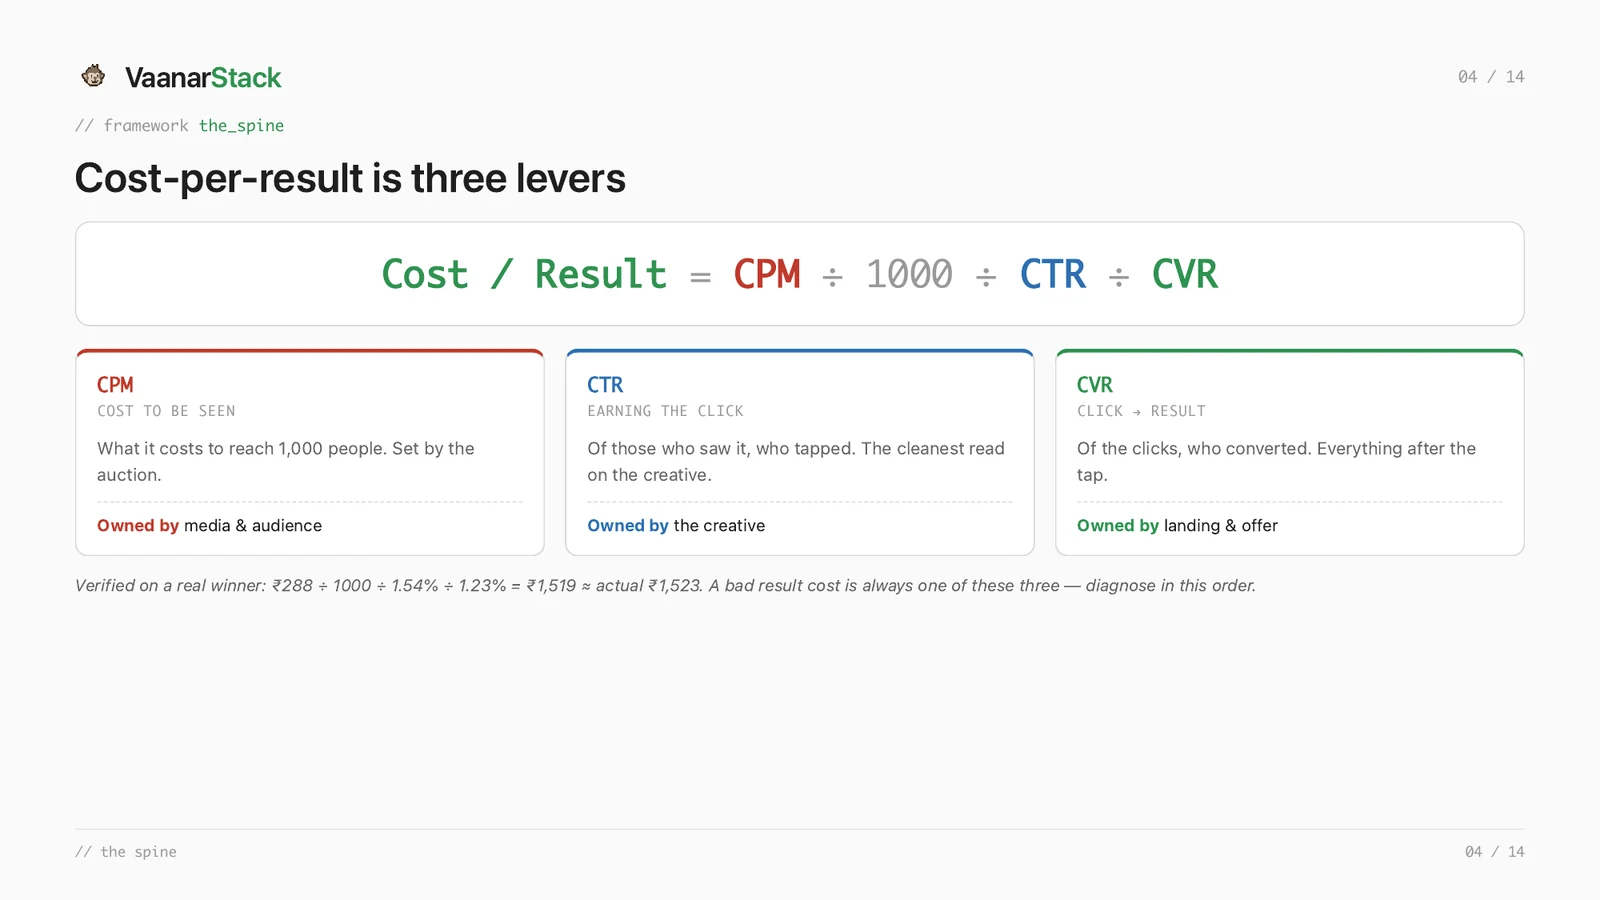
Verified on a real winning ad: ₹288 ÷ 1000 ÷ 1.54% ÷ 1.23% = ₹1,519, against an actual cost per result of ₹1,523.
Cost per result decomposes into three levers, in order
Cost per result = CPM ÷ 1000 ÷ CTR ÷ CVR. Three levers, three different owners, and they have to be diagnosed in that order — because each one inherits the one before it.
| Lever | Owned by | What to change |
|---|---|---|
| CPM — cost to be seen | Media & audience | Audience width, frequency, seasonality. A rising CPM on a stable audience is fatigue or auction, not targeting. |
| CTR — earning the click | The creative | Hook, offer clarity, creative-audience match. Low CTR with a normal CPM is a creative problem, full stop. |
| CVR — click to result | Landing page & offer | Page speed, promise-match, price against expectation. |
A strong hook with a bad CVR is a landing-page problem
High hook, high CTR, flat sales is the signature of a promise the page does not keep. The ad is not the thing to change. One caution on comparing result costs at all: they are only comparable within the same result event. ₹0.09 per view and ₹1,500 per sale are not the same axis.
Is hook rate a vanity metric?
Measured on its own against a benchmark you found on the internet, yes — it is a number that goes up without telling you whether anything got better. Measured against your own account's history and paired with hold rate and cost per result, no: it is the fastest way to localise a creative problem to a specific three seconds of a specific asset. The metric is not the problem. Reading it alone is.
Kill or refresh? The decision, once you have the numbers
Hook and hold tell you where the ad breaks. They do not, on their own, tell you whether to retire it — that needs one more question.
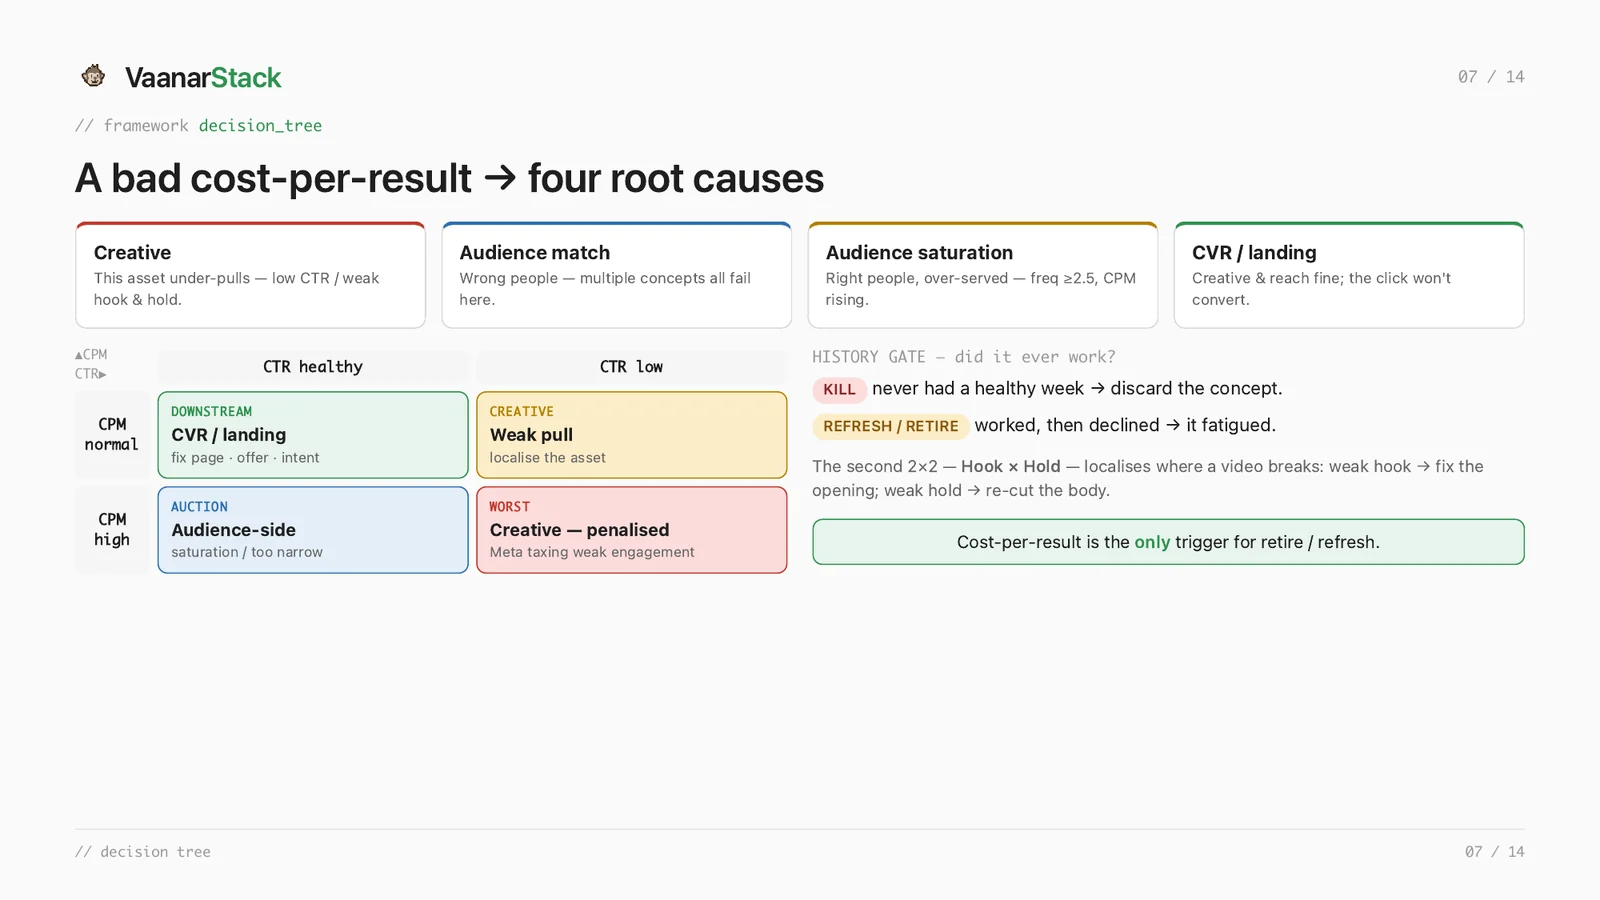
The history gate is the part most frameworks miss: did this ad ever work?
Kill is the concept. Refresh is the angle.
An ad that never had a healthy week never earned its place — discard the concept. An ad that worked and then declined is fatigued — the concept is proven and what it needs is a new cut. Same symptom, opposite response, and the only thing separating them is history.
The four fatigue verdicts
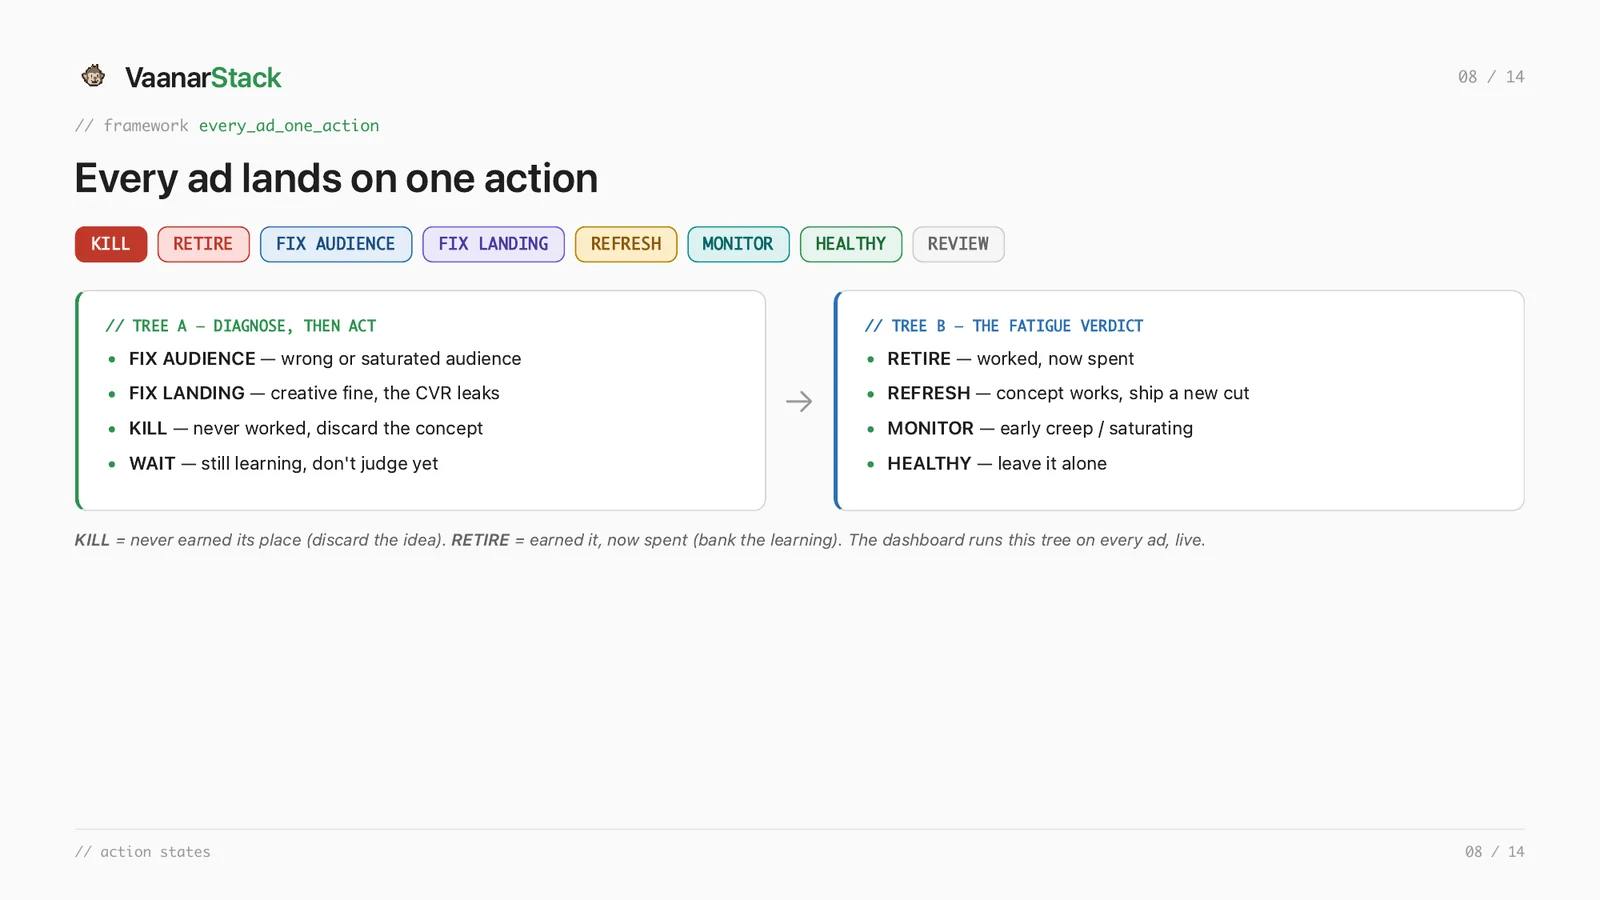
- Retire — it worked, it is now spent. Bank the learning.
- Refresh — the concept works, ship a new cut.
- Monitor — early creep or saturation. Watch, do not act yet.
- Healthy — leave it alone.
Cost per result is the only trigger for retire or refresh. Hook and hold tell you what to change; the result cost tells you whether to change anything at all. If you want the fuller version of this, we wrote up whether an AI assistant can actually detect creative fatigue, and the Meta Ads MCP capability guide covers what the connector will and will not give you.
We run this framework as a paid audit — every ad in the account graded, with the hook, hold and cost-per-result decomposition behind each call. If that is useful, see how the Meta ads audit works.
Frequently asked questions
How do you calculate hook rate and hold rate?
Hook rate = 3-second video views divided by impressions. Hold rate = 15-second views (ThruPlays) divided by 3-second views. A third measure, hold rate at 75% completion, divides 75% video watches by 3-second views. Both hold rates are ratios of views to views, not of views to impressions.
What is a good hook rate on Meta ads?
Under 15% is poor and needs fixing. 25–30% is average, 30–40% is strong, and 40%+ is elite. Below 15% the ad is effectively invisible, and every downstream metric is being computed on a sliver of your audience.
What is a good hold rate?
On the 15-second measure, under 10% is poor, 15–20% is average, 20–30% is strong and 30%+ is elite. On the 75%-completion measure the bands are lower: under 5% poor, 8–12% average, 12–20% strong, 22%+ elite. Treat both as direction rather than a pass mark, because objective and CPM move the floor.
What's the difference between hook rate and hold rate?
Hook rate measures whether your first frame stopped the scroll, and it is the only one of the two measured against impressions. Hold rate measures whether the ad kept the people the hook stopped, so it is conditional on the hook. A weak hook shrinks the denominator and can make a mediocre ad's hold rate look good on a small base.
My hook rate is high but sales are flat — what does that mean?
It means the creative is doing its job and the problem is downstream. Decompose the result cost: cost per result = CPM ÷ 1000 ÷ CTR ÷ CVR. A high hook rate with a healthy CTR and flat sales points at CVR, which is owned by the landing page and the offer, not by the ad.
Should I kill an ad with a bad hook rate, or re-edit the first three seconds?
Check the hold rate first. A weak hook with a strong hold means the concept works and only the opening is failing, so re-edit the first three seconds and keep the ad. If both hook and hold are weak, the concept is not landing and a new opening will not save it. And check whether the ad ever had a healthy week: an ad that worked and then declined should be refreshed, not killed.
FAQ
How do you calculate hook rate and hold rate?
Hook rate = 3-second video views divided by impressions. Hold rate = 15-second views (ThruPlays) divided by 3-second views. A third measure, hold rate at 75% completion, divides 75% video watches by 3-second views. Both hold rates are ratios of views to views, not of views to impressions.
What is a good hook rate on Meta ads?
Under 15% is poor and needs fixing. 25-30% is average, 30-40% is strong, and 40%+ is elite. Below 15% the ad is effectively invisible, and every downstream metric is being computed on a sliver of your audience.
What is a good hold rate?
On the 15-second measure, under 10% is poor, 15-20% is average, 20-30% is strong and 30%+ is elite. On the 75%-completion measure the bands are lower: under 5% poor, 8-12% average, 12-20% strong, 22%+ elite. Treat both as direction rather than a pass mark, because objective and CPM move the floor.
What's the difference between hook rate and hold rate?
Hook rate measures whether your first frame stopped the scroll, and it is the only one of the two measured against impressions. Hold rate measures whether the ad kept the people the hook stopped, so it is conditional on the hook. A weak hook shrinks the denominator and can make a mediocre ad's hold rate look good on a small base.
My hook rate is high but sales are flat - what does that mean?
It means the creative is doing its job and the problem is downstream. Decompose the result cost: cost per result = CPM / 1000 / CTR / CVR. A high hook rate with a healthy CTR and flat sales points at CVR, which is owned by the landing page and the offer, not by the ad.
Should I kill an ad with a bad hook rate, or re-edit the first three seconds?
Check the hold rate first. A weak hook with a strong hold means the concept works and only the opening is failing, so re-edit the first three seconds and keep the ad. If both hook and hold are weak, the concept is not landing and a new opening will not save it. And check whether the ad ever had a healthy week: an ad that worked and then declined should be refreshed, not killed.
